Emergency Department Throughput Optimization
Real-time LOS tracking, LWBS risk alerts, and boarding detection — all surfaced from your existing EHR without custom integration work.
The metrics that determine your ED's operational performance
Mediflowly surfaces these in real time, not in next month's dashboard. Each metric below is calculated from your EHR data within 60 seconds of event capture.
LOS
ED Length of Stay
Time from arrival registration to discharge or inpatient admission. Tracked by acuity level (ESI 1–5) and care pathway. Mediflowly surfaces rolling median, 90th percentile, and individual outliers in real time.
LWBS
Left Without Being Seen
Percentage of registered patients who leave before receiving physician evaluation. A leading indicator of wait-time perception and capacity pressure. Mediflowly flags rising LWBS risk by hour and flags queue length thresholds.
Door-to-Bed
Triage-to-Bed Assignment Time
Time elapsed between triage completion and first bed assignment. A key driver of LWBS and overall LOS. Mediflowly tracks this in real time by triage nurse, acuity level, and time of day to surface staffing and capacity patterns.
Boarding
Boarding Patient Time
Time an admitted ED patient waits for an inpatient bed after admission order. The single largest driver of ED overcrowding. Mediflowly alerts bed management at 2-hour and 4-hour boarding thresholds and surfaces the downstream bed pipeline.
CMS OP-18 Reporting Context
CMS OP-18 (Outpatient Emergency Department — Median Time from ED Arrival to ED Departure for Admitted ED Patients) is a Hospital Outpatient Quality Reporting measure that affects hospital star ratings and public reporting. Mediflowly is designed to surface the underlying patient flow data that drives your OP-18 metric — giving your operations team visibility into contributing factors before they show up in quarterly reports.
Note: Mediflowly is designed to surface data relevant to CMS OP-18 tracking. It is not a CMS-certified reporting tool and does not submit data to CMS directly. Consult your quality reporting team for official submission requirements.
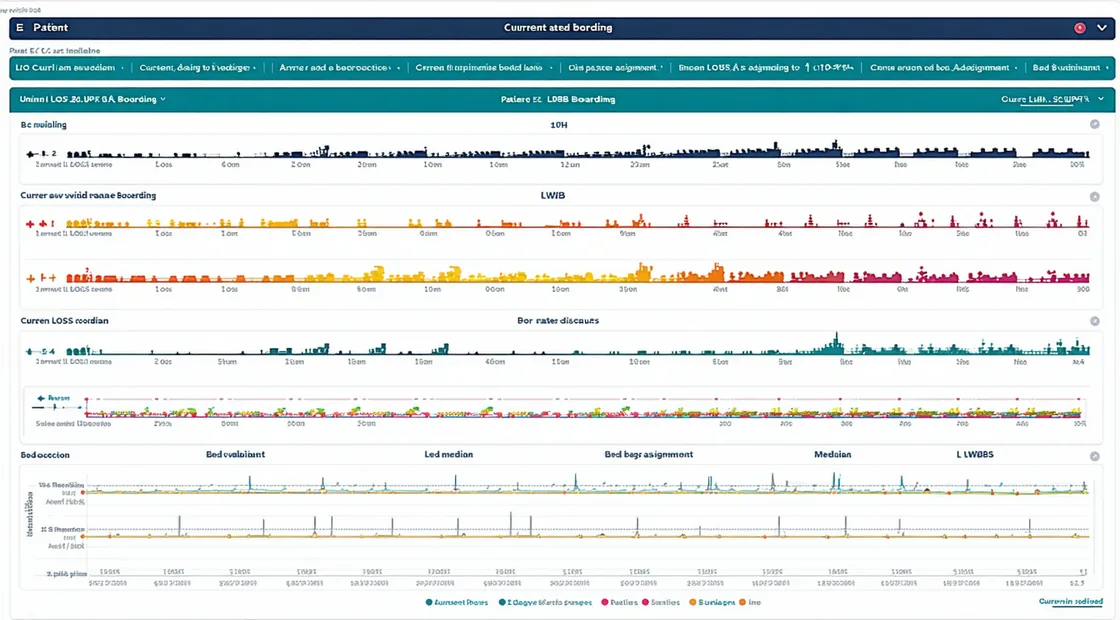
The ED Flow dashboard
A single screen your charge nurse, bed coordinator, and ED medical director all use simultaneously.